ESTIMATION OF TABLET SCANNERS
It is a little the theory
The most important characteristic of tablet scanners is optical resolution.
As a rule as parameter for an estimation of optical resolution of scanners the number of sensitive elements of the receiver CCD is used.
Thus the influence both transfer characteristic of the receiver CCD is not taken into account, and gear characteristic objective,
which focuses the image in a plane of the receiver. The Transfer characteristic of the scanner determining quality of the image,
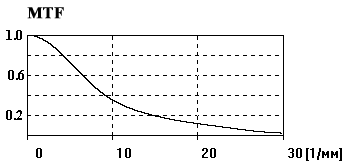
most full is described by modulation transfer function (MTF) in the field of spatial frequencies. In optics the spatial frequencies
are determined as number of lines on mm, i.e. size of [1/mm]. MTF characterizes fall of contrast of a sine wave component of a
signal of the image. As an example on fig.1 the curve MTF is submitted.
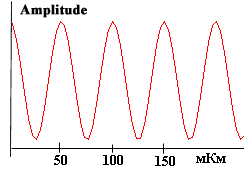
MTF characterizes communication between initial object and its image, as follows. As object we shall consider (examine)
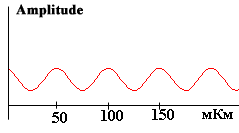
sine wave distribution of contrast - fig.2. On fig.3a section sine-shaped of object with frequency of 20 [1/mm] is submitted. The scope sine
characterizes contrast of object on an input of the scanner. On an output of the scanner the image sine will be characterized by section
on fig.3b. Thus it is visible, that MTF on frequency of 20 [1/mm] shows fall of a signal sine from size 1.0 on an input of the scanner up to
size 0.15 on its output.
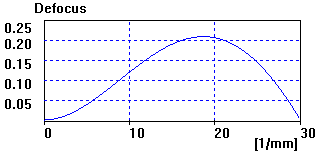
To receive more sensitive tool for a rating of values MTF it is enough to fulfil subtraction of this MTF H(ŋ) from diffraction,
i.e. from maximum accessible MTF Ĥ(ŋ):
D(ŋ) = Ĥ(ŋ) – H(ŋ),
ŋ - spatial frequency. The example difference MTF D(ŋ) is shown in a figure 4a.
The curve difference MTF D(ŋ) characterizes the value of an error which
will be stipulated by a degree of misalignment or/and quality of the optical system of the scanner.
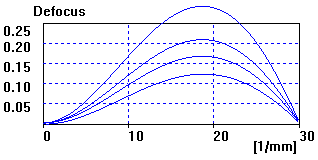
In many cases, such error to some extent is stipulated by defocusing. And it is real if to look at a curve on fig. 4a,
it reminds a curve of defocusing. On fig. 4b the example of a set of diagrams for various values of defocusing
(loss of sharpness) represented. The more difference MTF, the it is worse than value optical resolution.
Thus it is possible to estimate (on peak of a curve) spatial frequency ŋ on which MTF has the greatest falling.
The size of details Ĺ on the image, is inversely proportional to spatial frequency ŋ,
and is approximately defined by relation Ĺ=1/2ŋ.
To receive values MTF on all spatial frequencies, there is no necessity to carry spend measurement of set of sine
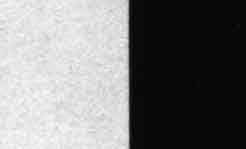
wave objects of various frequencies. It is enough to analyse the image as sharp jump of contrast (fig.5), i.e. image knife-edge.
Differentiation and transformation Fourier knife-edge will give required MTF.
Fig.5.
Practical example: measurement MTF of the tablet scanner Snap Scan 600 (Agfa)
1. At the first stage it is necessary to make and to scan object as sharp knife-edge.
Such object from two gradation can be printed out with the help of the printer or to cut out a strip from black photographic paper.
It is important, that on border black and white there were no transitive gradation grey or fringe.
The object is scanned in two directions. After scanning, the images are kept in files without compression in formats TIFF or BMP.
The size of the image should be not less than 256 x 256 pixels.
These files are sent to us on .
In the letter it is necessary specify a type of the scanner and densely of lines inch (or millimeter), with which the scanning, i.e. dpi or lpi was carried out.
2. At the second stage the file of the image is processed with the help of our program.
The example is submitted below. On fig.6 the image knife-edge is shown with scanning along a line (direction X), lpi = 600.
On fig.7 the image knife-edge is shown with scanning on still (direction Y), lpi also equally 600.
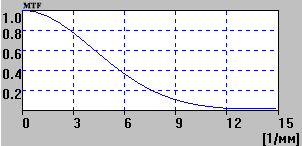
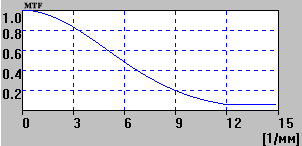
On fig.8 and fig.9 are submitted MTF of the scanner Agfa, accordingly for directions X and Y.
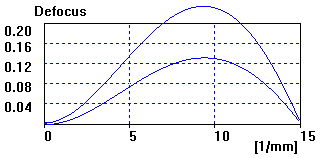
On fig. 10 curve "defocusing" of these of two MTF are shown. The upper curve corresponds to direction X,
and a lower curve - to direction Y.
Fig. 10.
3.
At the last stage we transfer you the obtained results, i.e. images of diagrams MTF (including curve "defocusing")
and a pair of summary tables. One table with values MTF, and another with values of "defocusing" curves.
Interpretation of results, first of all, is grounded on the analysis "defocusing"
curves and due to this is simple enough and obvious. In our concrete case it is visible, that optical resolution in direction Y is worse,
than in direction X. Thus, falling of contrast on spatial frequency 9 [1/mm] in direction X almost on 10% exceeds falling contrast
in direction Y.
| [1/mm] |
0.0 |
3.0 |
6.0 |
9.0 |
12.0 |
15.0 |
| MTF-x |
1.00 |
0.77 |
0.36 |
0.11 |
0.01 |
0.01 |
| MTF-y |
1.00 |
0.82 |
0.50 |
0.20 |
0.08 |
0.08 |
|
| [1/mm] |
0.0 |
3.0 |
6.0 |
9.0 |
12.0 |
15.0 |
| Defocus-x |
0.00 |
0.08 |
0.17 |
0.25 |
0.20 |
0.02 |
| Defocus-y |
0.00 |
0.04 |
0.09 |
0.14 |
0.11 |
0.01 |
|


