Method and software of automatic resolution evaluating of optic-electronic telescopic land remote sensing system
Russian (Оценка разрешающей способности оптико-электронных систем космического базирования)
M.V. Smirnov, A.N. Korolev, I.N. Sivjakov, D.I. Zvezdin.
Vavilov State Optical Institute, Saint-Petersburg, Russia
ABSTRACT
 This article deals with automatic evaluation of resolution of optic-electronic telescopic system (OETS)
for Earth remote sounding duringits prolonged operation. Initial information for resolution evaluation isdigital arrays of
video-data, that is images of Earth surface, saturated with objects in a form of sharp knife-edges(urban blocks, industrial
objects, etc.). Results of video-data analysis (evaluating MTF and evaluating level of noise), as well as parameters of path
of OETS, including a ground processing complex and video-data visualization are used for pre-distortion of 3-bared mire.
Evaluation of resolution is done in iterations with changing of mire size. Resolution is spatial frequency of 3-bared mire
for which the probability of detecting the central mark with the background of neighbouring spacings by the observer has
the required value. Software is developed and experiments are performed with test and
real images. The Interactive Mode & Physical Principles of software is shown in a separate window.
Demo version of software.
This article deals with automatic evaluation of resolution of optic-electronic telescopic system (OETS)
for Earth remote sounding duringits prolonged operation. Initial information for resolution evaluation isdigital arrays of
video-data, that is images of Earth surface, saturated with objects in a form of sharp knife-edges(urban blocks, industrial
objects, etc.). Results of video-data analysis (evaluating MTF and evaluating level of noise), as well as parameters of path
of OETS, including a ground processing complex and video-data visualization are used for pre-distortion of 3-bared mire.
Evaluation of resolution is done in iterations with changing of mire size. Resolution is spatial frequency of 3-bared mire
for which the probability of detecting the central mark with the background of neighbouring spacings by the observer has
the required value. Software is developed and experiments are performed with test and
real images. The Interactive Mode & Physical Principles of software is shown in a separate window.
Demo version of software.
Key words: resolution, test chart 3-bar, optic-electronic telescopic system, MTF, knife-edge.
1. INTRODUCTION
One of the actual tasks of metrologic control of an OETS system for remote sounding while its prolonged operation
is the automation of routine procedure of resolution evaluation by a digital image of the Earth. Procedure of automatic determination
of resolution for space optic-electronic observing system with test marked mires on ground surface is examined in work [1]. The basis
of procedure [1] of resolution evaluation is recognition of marked mire. Disadvantage of the approach is the necessity of on-Earth
location of special test objects along the flight trace. The other work [2] suggests to determine the resolution of system of optical
range as the exit point of averaged over Fourier specter image on horizon, corresponding to noise level. But the accuracy of this
method is not high because of the accepted assumptions.
We have developed the procedure of automatic evaluation of resolutionover the Earth image without test objects on ground.
It is realized as a program package. Resolution is determined as spatial frequency of test chart 3-bar for which the the probability
of detecting its central mark with the background of neighbouring spacings by the observer has the following value:
where p(v)- is the probability of detecting the central mark with the background of neighbouring spacings
between the bares on the final photo-document, Po - the defined value of probability of detecting the mire bare,
v - the required spatial frequency.
Probability p(v) is calculated on the base of MTF and OETS noise level evaluation which are determined
experimentally by images of knife-edges while analysis of digital arrays of video-data. Recognition, distinguishing and analysis of
the searched knife-edges are done in automatic mode independently on level of the external illumination.
Mathematical apparatus of recognition of knife-edge image is based on structural-probable approach, considers the structure of the
recognized object and provides adaptation to changes of the external illumination. Distribution of intensity in direction perpendicular to
knife-edge B(x,y) is the realization of boundary curve U(x). A set of realizations of boundary curves is averaged.
The result of differentiation of the averaged boundary curve is the Line Spread Function (LSF). MTF is determined as Fourier
transformation of LSF. The level of noise is determined as root-mean-square (RMS) and is evaluated over the uniform distances
of intensities.
The method is realized as a program package in Borland C++ with library of classes
Object Windows Library. Input and visualization of initial arrays of video-data and all results of images transformation while their
analysis is provided in this package.
2. THEORY AND ALGORITHMS
Accuracy of MTF determination over the image of knife-edge is linked with value of signal/noise ratio.
The latter defines the distinguishing of the heaviest changes of intensity. Recognition of objects with heavy intensity changes is not
difficult. The specific feature of the task is to satisfy the condition of invariability concerning the changes of external illumination while
recognition of the searched intensity changes.Variable illumination is connected with meteo conditions, depends on daytime and season.
The listed situations bring to different image signals from the same objects or districts. Moreover, algorithm of recognition should satisfy
the condition of belonging of intensity sharp change to the structure of knife-edge.
Mathematical apparatus of knife-edge image for the above procedure is based on the structural-probable approach [3]. The structural
analysis of the image provides object description on the base of distances and correlation between them. Image of knife-edge is a
division line between light and dark continuous objects. We call them indicator(display) lines (fig.1a).
 |
Indicator lines are taken away from considration, if intensity differences (changes) dB over area dR do not exceed the threshold Tb.The remain set of indicator lines will represent the lines of the required knife-edges.And the graph representation of knife-edges B(x,y) is the intensity distribution of the boundary curve U(x) (fig.1b). The probability of distinguishing of the most sharp changes of intensity exceeding the threshold Tb, where P(Z) - density of probability of image intensity differences. In analyzing the OEST quality by the current digital fragment the reverse task of determination of threshold Tb by the current distribution P(Z) is solved. So, the threshold parameter Tb used in recognition procedure is adaptive and automatically reconstructed depending on concrete intensity distribution. The threshold parameter Tb is determined from distribution of probability distribution P(dB), where P(dB) - the probability density of absolute values of intensity differences dB, pdB - threshold probability.
One of the approaches for the approximate evaluation of unknown probabilities pdB over the selected data is learning with teacher [4]. Distributions P(dB) are formed over the selected images (urban blocks, industrial objects, etc.). After that the best (from "teacher's" point of view) valuesof parameters Tb are specified, at which knife-edges with the most sharp intensity differences dB are distinguished. Threshold probability pdB is determined by the value of threshold parameter Tb.
After recognition system is taught, the tested images are presented. Evaluated distributions P(dB) are constructed over each image and the reverse task of determination of parameter Tb by threshold probability pdB is solved . Further evaluation Tb is used as true value of parameter Tb. As a result of the threshold usage,the required knife-edges B(x,y) will be selected. Realization of boundary curve U(x) is determined in direction perpendicular to image of knife-edges B(x,y). To calculate LSF, module U(x) is differentiated. MTF T1(v) in OETS path is determined as a module of Fourier transformation of LSF.
RMS evaluation of noise is based on measurements of intensities for the top and bottom parts dW of boundary curves (Fig.1b). Light and dark areas of knife-edge images correspond to these parts. In RMS calculation of noise sigma the values of noise power for top and bottom parts are averaged. Probability of mire resolution is defined by probability of its center mark detection on the background of the neighbouring spacings. It is determined of the known formula:
where erf(Z) - reduced Laplas function, S - ratio signal/noise, Co - adjusting coefficient for compensation of an error due to incorrect description of OETS path model, including the observer model, Q - ratio of vision noise to system noise averaged over bare.
3. EXPERIMENTAL RESULTS
To check algorithms of recognition for knife-edge image and MTF measuring under different conditions of survey(filming), three types of scenes for the same district were realized.These scenes are presented in fig.2. The first scene-initial non-distorted image (fig.2a), the second one - the image, registered with low illuminance (fig2b),the third one - the image distorted by defocusing of an optical system (fig.2c).
 |
All three scenes are introduced into computer by input TV system including a CCD-receiver and a lens. Histograms of distribution of intensity levels corresponding to scenes in fig.2(a,b,c) are presented in fig.2(d,e,f). For each image evaluating distributions PdB were obtained, and reverse task of determination of the threshold parameter Tb was solved. These results are presented in fig.3(a,b,c) in accordance with the initial scenses.
 |
With the help of the obtained parameters Tb the required knife-edges were distinguished,
realizations of boundary curves U(x) were measured, corresponding PSF and MTF were determined. MTF data for three
represented scenes are shown in fig.3(d,e,f), correspondingly.
Comparison of fig.3a and fig.3b shows that reducing of external illuminance brings to automatic change of threshold Tb
. With this, change of MTF (fig.3d and fig.3e) at the spatial frequency 20 [1/mm] has made about 6%.
So, change of the external illumination characterized by change of video-signal dynamic range in 1.7 times (fig.2d and fig.2e) brings to
insufficient errors in MTF measuring. Response to defocusing of an optical system may be evaluated by comparison of graphs in fig.3d
and fig.3f.
Procedure of error correction in formula (1) stipulated by incorrect description of OETS path including model of visual analyzer is
periodically performed. At video-data receipt in OETS maintenance, the evaluation of resolution by the developed software is done.
In automatic mode by the video-data obtained evaluations of MTF, RMS of noise, resolution are performed. Periodically,
dependingon survey(filming) conditions while Earth sounding, correction of resolution calculation is done. Algorithm for determination
of the correcting parameter Co in formula (1) is presented in fig.4.
 |
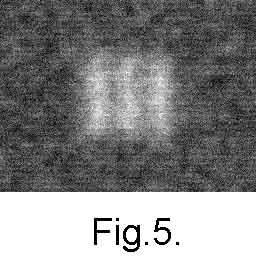
MTF and RMS of OETS noise obtained with our software are used for simulation of a set of test charts 3-bar with different frequency. These images are shown on monitor for visual evaluation of the ultimate-resolved mire. The example of such image is presented in fig.5.
The result of calculation for resolution Vp[1/mm] obtained by the developed
software and that of expert visual evaluation Vb[1/mm] are used for the decision of table
equation Vp(Co)=Vb in respect to Co. So obtained value of
Co acts as the current correcting coefficient in formula (1).
According to the described algorithm (fig.4) experiments on evaluation of resolution on model and real images introduced into
computer by standard TV system were performed. Comparison of calculation results obtained by software and that of visual
evaluation shows that for model images the error of resolution makes about 5%, for real ones - about 7%.
4. REFERENCES
- I.N. Beloglazov, Automated Technique of Determination of Dependence of Resolution of a Optical- electronic System of Remote Sounding from Height of Supervision, Earth Research from Space , 1994, N3, p.53-61.
- V.V. Gogokhiya, Definnition of a Spatial Resolution for Multispectral Scanning Devices Using Test Survey Data, Earth Research from Space, 1993, N 2, p.57-62.
- A.L. Gorelic, I.B. Gurevich, V.A. Skripkin, Modern condition of a problem of recognition, Radio&Sviaz, Moscow, 1985.
- R.O. Duda, P.E. Hart, Pattern classification and scene analysis, Wiley Interscience Publication Wiley&Sons, New York, 1973.
- Program Package for measurement of resolution of optical-electronic system
- Physical simulation of optical-electronic system of high-resolution
 Home
Home Node.js/Express/Full-Stack
 To help ATMs - protection via hidden water marks
 The elements of the probabilistic analysis of the Forex market
 Registration and restoration of digital Fourier holograms
 Software for evaluating of ground resolution of remote sensing optical-system
- Watermarking photos
 Restoration of images
- Physical simulation of optical-electronic system of high-resolution
- Technology of counteraction to falsification of credit cards
 Import Excel into Opencart
 Free Advertisment. Free Bulletin Board (russian)
 Contact us
- Software Prices
 VIN number anti-theft